Phosphomatics documentation
For global phosphoproteomics, analysising phosphopeptides via mass spectrometry and processing the raw data with suftware such as MaxQuant typically produces a large and unintelligible list of phosphoproteins and quantification values. A significant degree of post processing is then required to identify differentially regulated phosphorylation sites and place these in the context of the underlying biology. This is frequently a complicated process requiring specialist training and many different software packages.
Phosphomatics aims to provide a unified platform that allows researchers to quickly conduct statistical and biological analysis of their mass spectrometry data.
Data Upload and Preparation
To begin a new analysis, select 'New Analysis' from the home page. Phosphomatics provides a convenient upload wizard that will help you to prepare your data for downstream analysis.
Wizard step 1 - File upload
Here, you can upload your raw data files. Three different files can be uploaded: An experimental data file, a parameter file and an annotation data file. Note that only the experimental data file is required. Requirements for these files are described below:
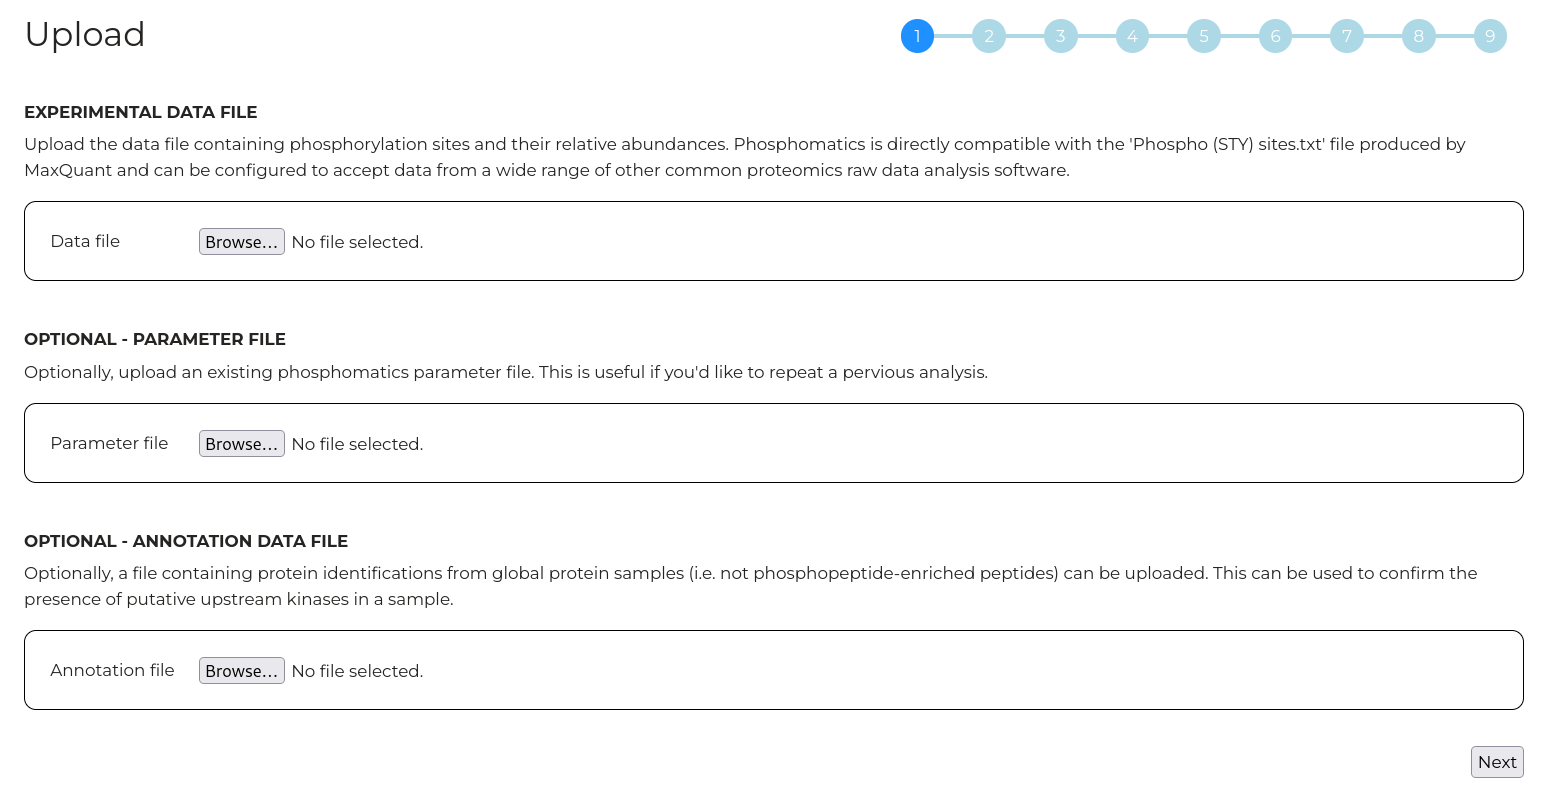
Experimental Data file
The experimental data file contains information about the identified phosphorylation sites and their relative quantities between samples. For example, this could be the 'Phospho (STY) sites.txt' file produced by MaxQuant or the PTM report produced by Spectronaut. Phoaphomatics is flexible with the format and can be adapted for a range of other search software however there are a few basic requirements. For each phosphoryaltion site, Phosphomatics input data file must contain:
- UniProt ID
- Phosphorylated residue (S/T/Y). These should be provided as one-letter amino acid codes.
- Phosphorylation site - i.e. an integer indicating the position of the phosphorylated residue within the protein.
- Quantification values for each sample. It is highly recommended the raw intensities be provided (i.e. not log-transformed quantities).
The heading lables of the columns that provide these data fields do not need to be renamed from those produced by search software and the order of the columns is not important.
Parameter file
If you wish to repeat a previous analysis with Phosphomatics, you can upload the parameter files you received with you previous dataset here and the processing parameters for this setup wizard will be auto-populated. This ensures that you can repeat your previous analysis exactly. This field is optional.
Annotation Data file
Phosphomatics suggests possible upstream kinases for observed phosphorylation sites based on indexes of known relationships. In cases where a given upstream kinase was itself identified in the experiment, it may be considered more likely to be responsible for a given phosphorylation site than another kinase that was not observed. Here, you can upload a supplementation list of identified proteins that will be used for annotation of kinases that were observed in an experiment. This, for example, could come from an analysis of global proteins that was run in parallel with phosphopeptide-enriched samples. This field is optional.
Wizard step 2 - Column selection
To be compabible with a wide range of search software, Phosphomatics lets you choose which columns from your experimental data file should be used for which purposes. The columns in the experimental data files that you uploaded are displayed in the slection box at left. Assign which columns should be used for the UniProt ID, phosphorylated residue, phosphorylation site and quantification values.
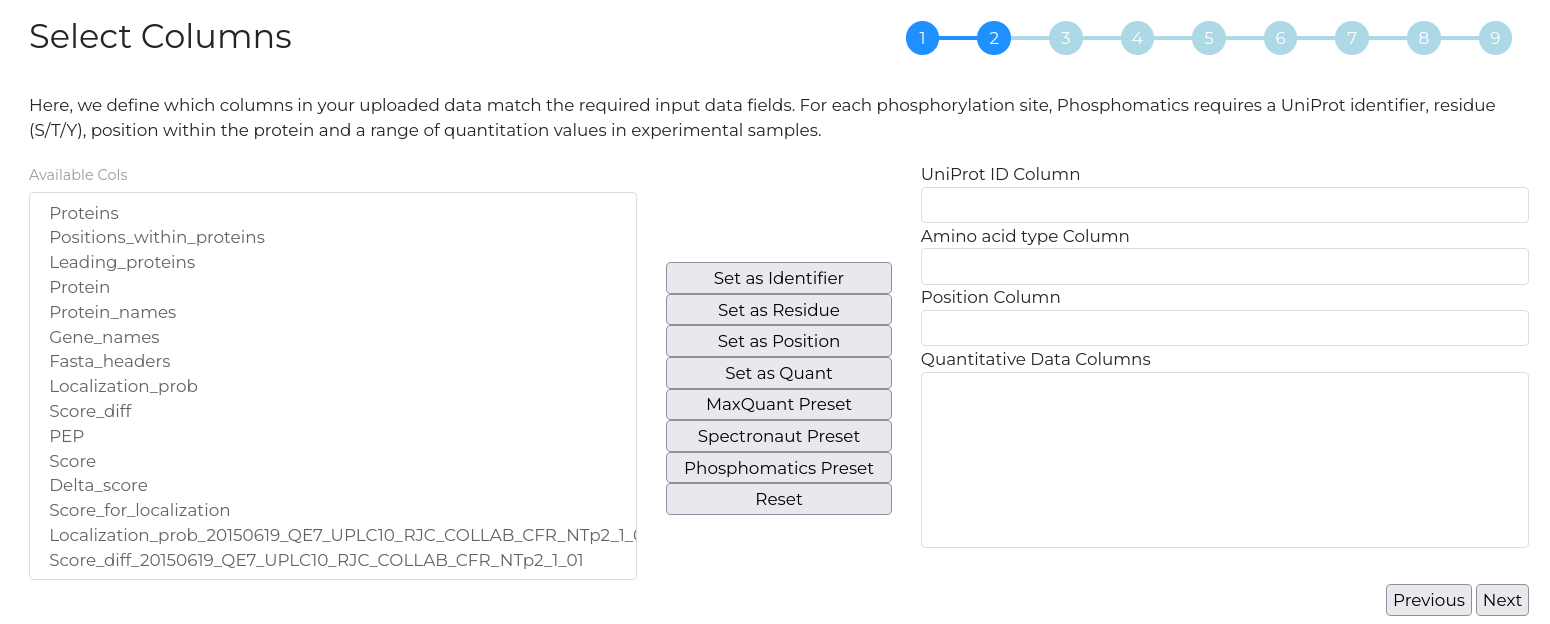
A number of preset data import ara available which will automatically detect the necessary columns and assign them as needed. For example, click the 'MaxQuant Presets' button to automatically set columns for the 'Pospho (STY) sites.txt' file produced by MaxQuant analysis.
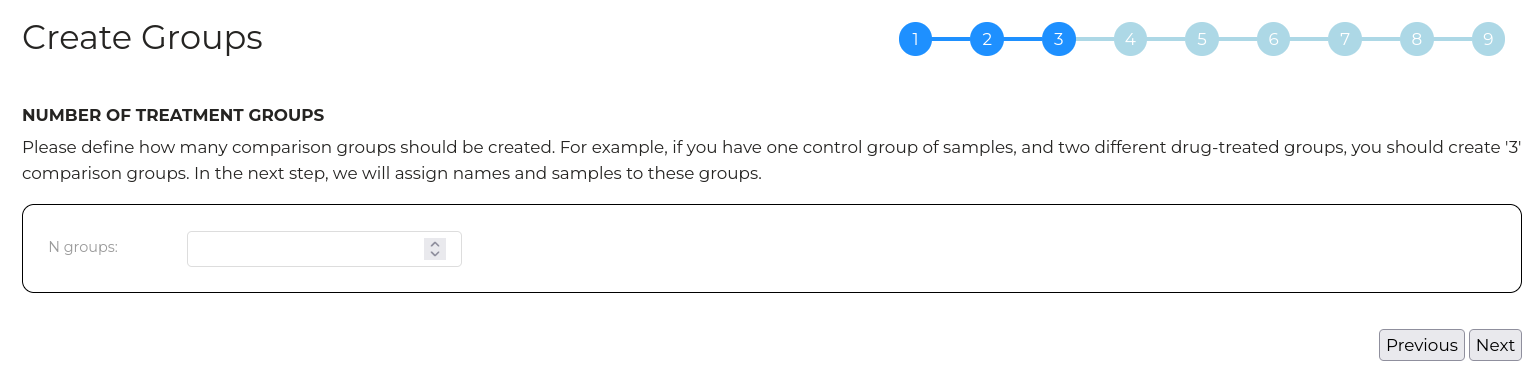
Wizard step 3 - Create groups
Enter the number of experimental comparison groups you have. For example, if you have data for 'wild type', 'mutant_1' and 'mutant_2', then entre 3.
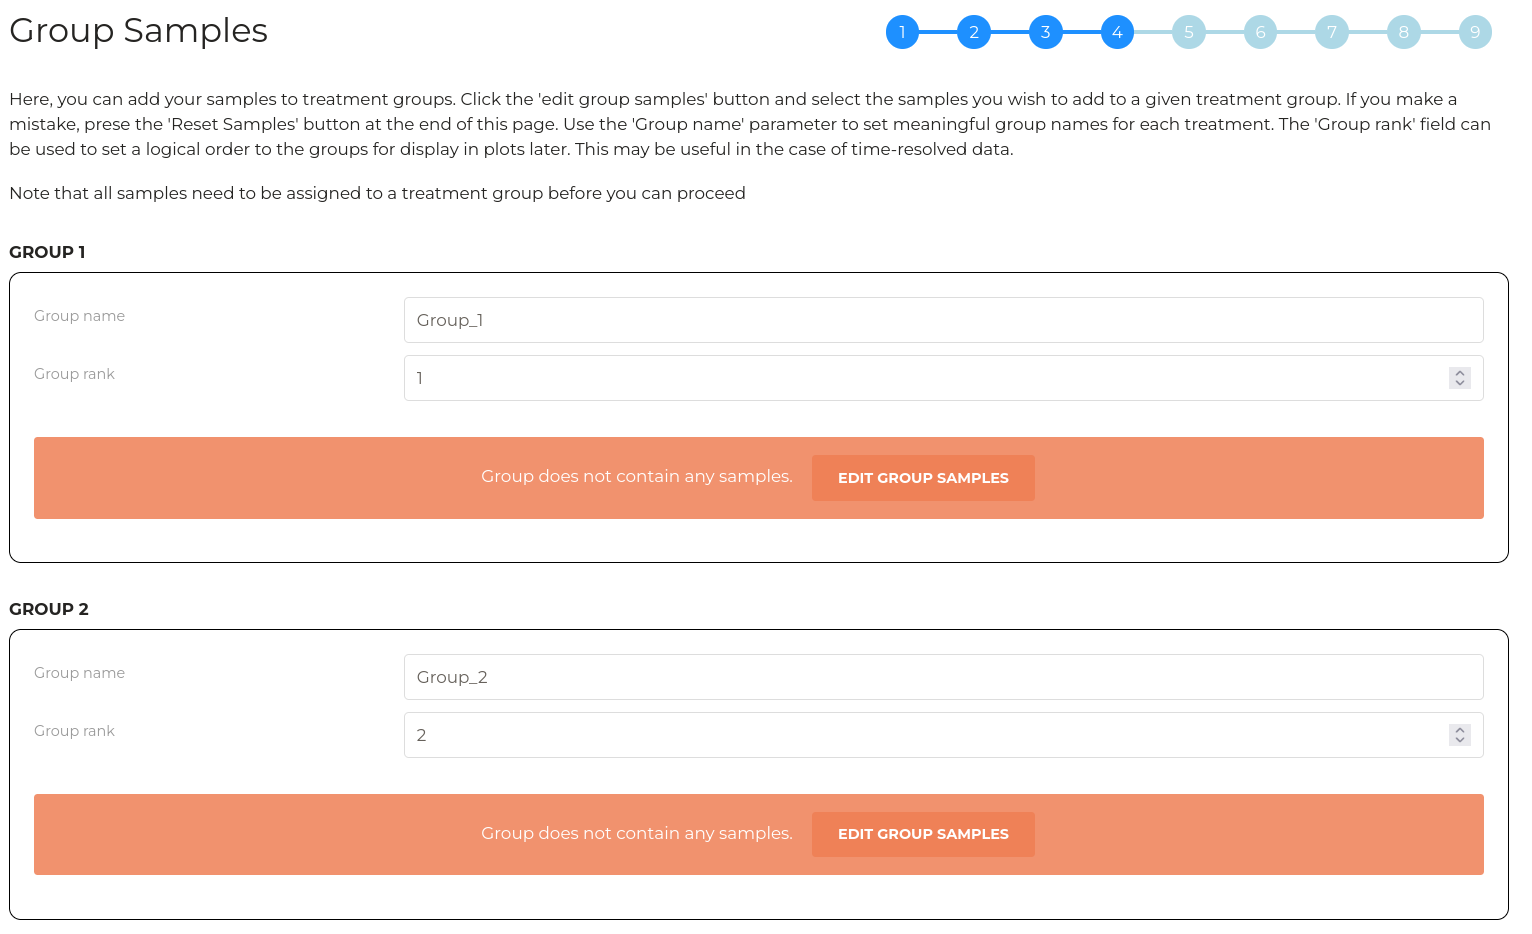
Wizard step 4 - Group samples
Here, we can configure treatment groups and experimental samples to their respective groups.
A number of boxes will appear that is consistent with the number of groups defined in the previous step. For each group, you can set a group name which will be used for plotting later and you can provide a group 'rank'. The group rank will define the order of sample groups when they are displayed in subsequent plots. This can be useful in cases where groups have a logical order such as in timecourse experiments.
Next, click the 'Edit Group Samples' button in each of the sample groups. A box will appear that displays the names of all unassigned quantification columns defined in step 2. Highlight the samples that belong to a given treatment group and click 'Submit'. Multiple samples can be added at once by holding 'Control' and clicking or by holding 'Shift' and clicking.
The selected samples will be diplayed in a table for each group. In the table, the 'alias' column allows you to define a shorter name for each sample which aids in presentation and plotting later. By default, the alias is assigned by removing any common prefix and any common suffix from the selected samples.
For compatibility with some statistical analysis scripts, treatment and sample alias nemes:
- Must contain alphanumeric characters only
- Must not contain spaces
- Must not contain special characters
- Must not start with a number
The 'next' button on this tab is disabled until all quantification columns (samples) have been assigned to a treatment group.
Wizard step 5 - Filter and impute data
Phosphoproteomics data typically contains 'missing' or 'zero' values for some phosphorylation sites in some samples. The fraction of total quantitative values that are missing depends on the sample type and LC-MS operating parameters. Many statistical tests require missing values to be removed (filtered) or replaced (imputed) with non-zero values. In this step, you can manage how data is filtered and imputed.
Note that this step is important since the combination of filtering and imputation must remove all missing values for a successful analysis with Phosphomatics.
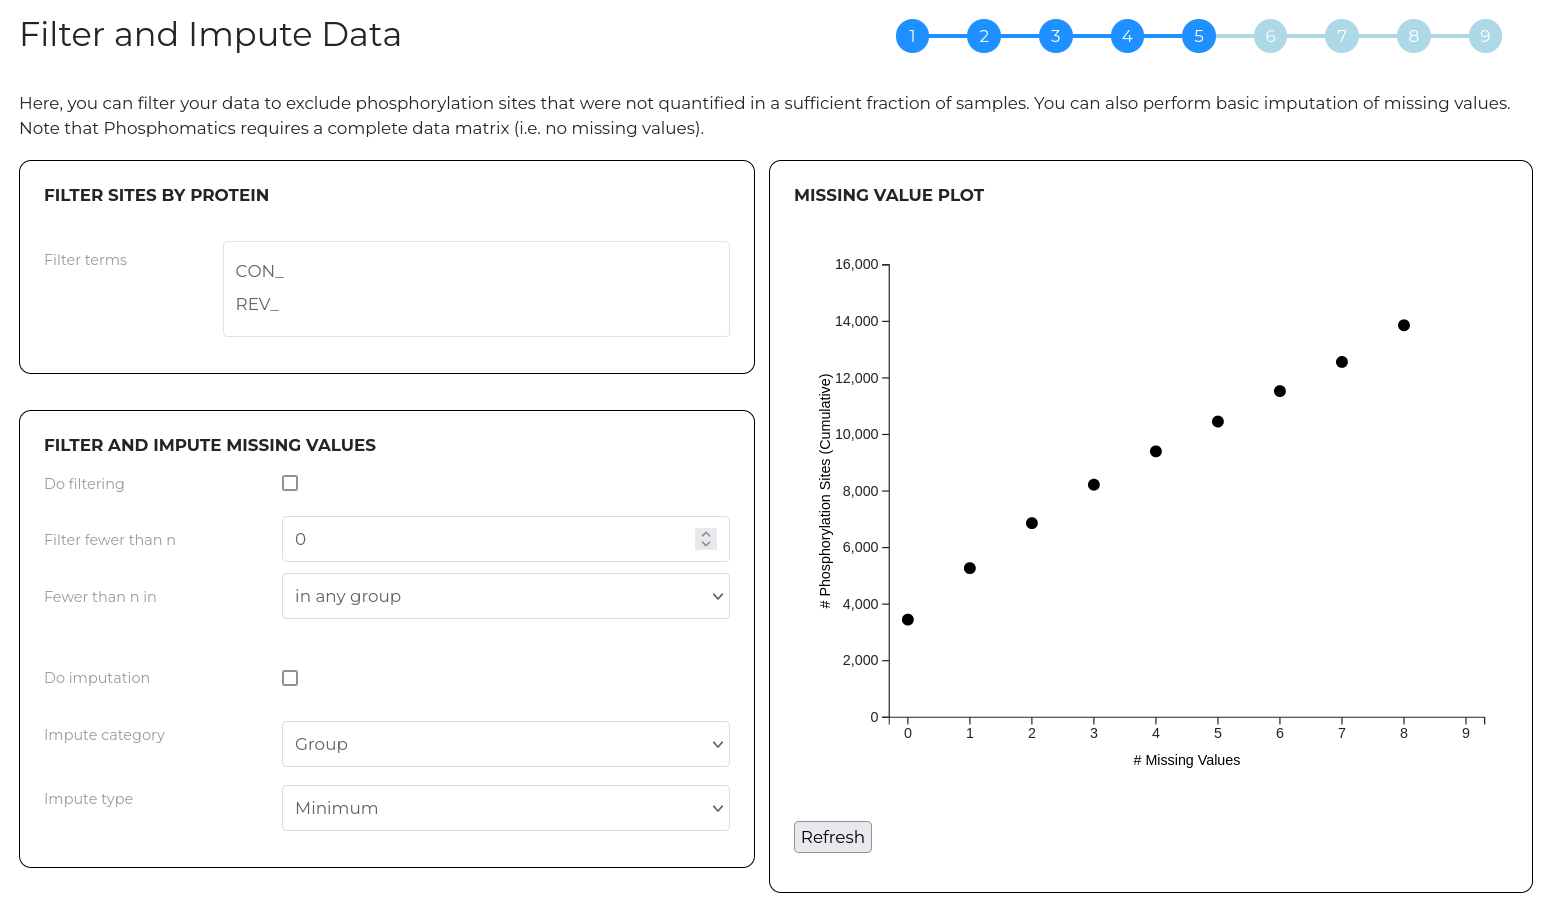
The first layer of filtering acts on the protein level. Here, we can filter phosphorylation sites out of any subsequent analysis by supplying strings of text that should be searched against entries in the UniProt ID column of your uploaded data. Phosphorylation sites with UniProt IDs that contain any of the text strings provided will be filtered. This is particularly useful for removing contaminant and decoy proteins prior to further processing.
The second layer of filtering allows you to remove phosphorylation sites that were inadequately quantified across samples. The plot at right gives an indication of the the extent of missing values in your data set. For example, using the example data which has 9 samples, we can see that approximately 3,500 phosphorylation sites have no missing values at all. If we include sites that have up to 1 missing value, we have approximately 5,500 sites. As such, this plot can be used to gauge how aggressively data can be filtered before meaningful infomration is lost.
By default, no filtering is applied. Check the 'Do filtering' checkbox to filter values by quantitative completeness. The 'Filter fewer than n' parameter allows you to set the number of samples in which a phosphorylation site must be quantitified (i.e. have a non-zero) value in order to be included in subsequent analysis. The 'Fewer than n in' parameter allows you to customise which category of samples the 'Filter fewer than n' parameter applies to.
Note that after changing a parameter, click 'Refresh' to update the plot with the new parameters applied.
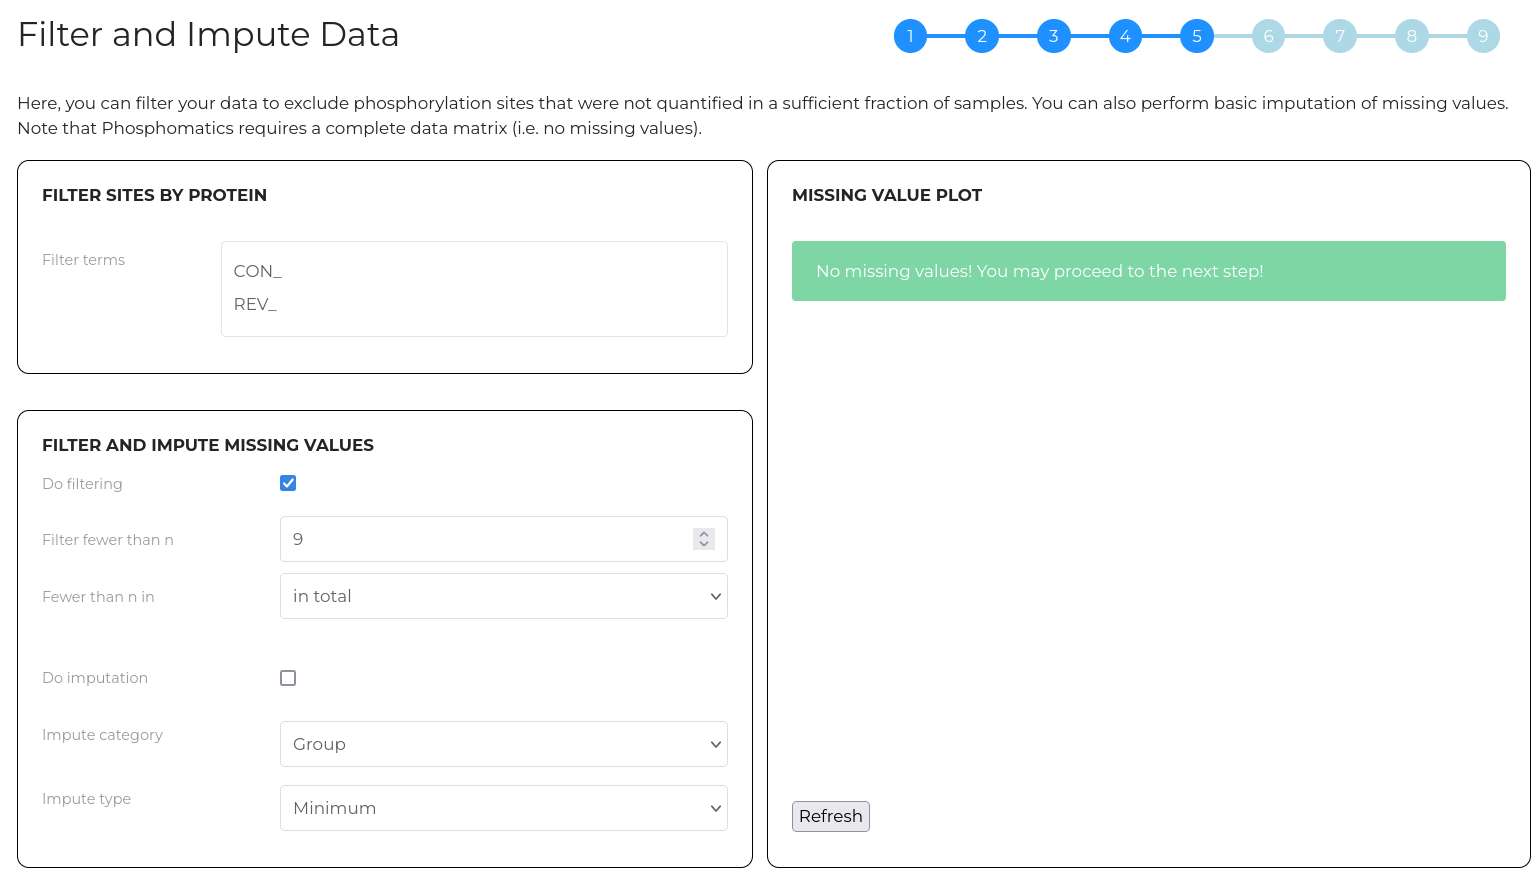
In some cases, all missing values may be removed by filtering out phosphorylation sites alone. In cases where missing values remain after filtering, values must be imputed. This means that the missing value is replaced with a non-zero value for the purposes of statistical testing. It is important not to impute too great a fraction of your data and the method of imputation should be chosen carefully! As a rule of thumb, generally imputing more than 25% of the quantitation values for any given phosphoorylation site should be avoided.
Check the 'Do imputation' checkbox to activate missing value imputation. The method by which the values used to replace missing values are determined can be selected using the 'Impute category' and 'Impute type' fields.
Click 'Refresh' to update the plot. Once the combination of filtering and imputation successfully removes all missing values, a green box indicating so will appear and you will be able to proceed to the next step.
Wizard step 6 - Transform data
Quantittive values in phosphoproteomics data are typically left skewed however many statistical analysis assume data is normally distributed. Here, you can apply a Log2 to your data to transform the quantitative values into a distribution that more closely approximates a normal distribution.
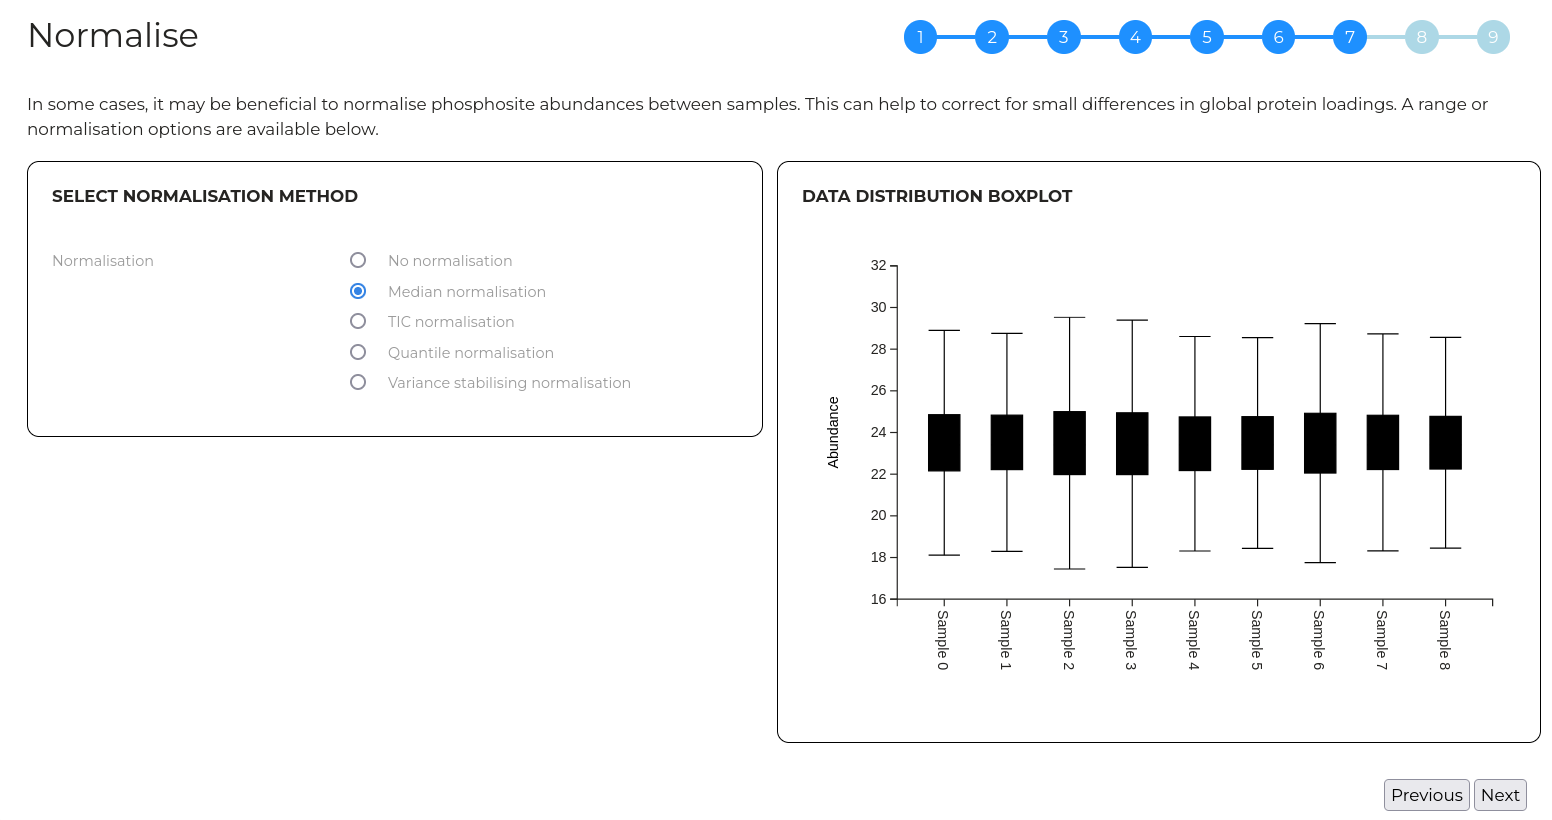
Wizard step 7 - Normalise data
Here, data can be normalised to compensate for random experimental errors if needed. A range of normalisation options are available.
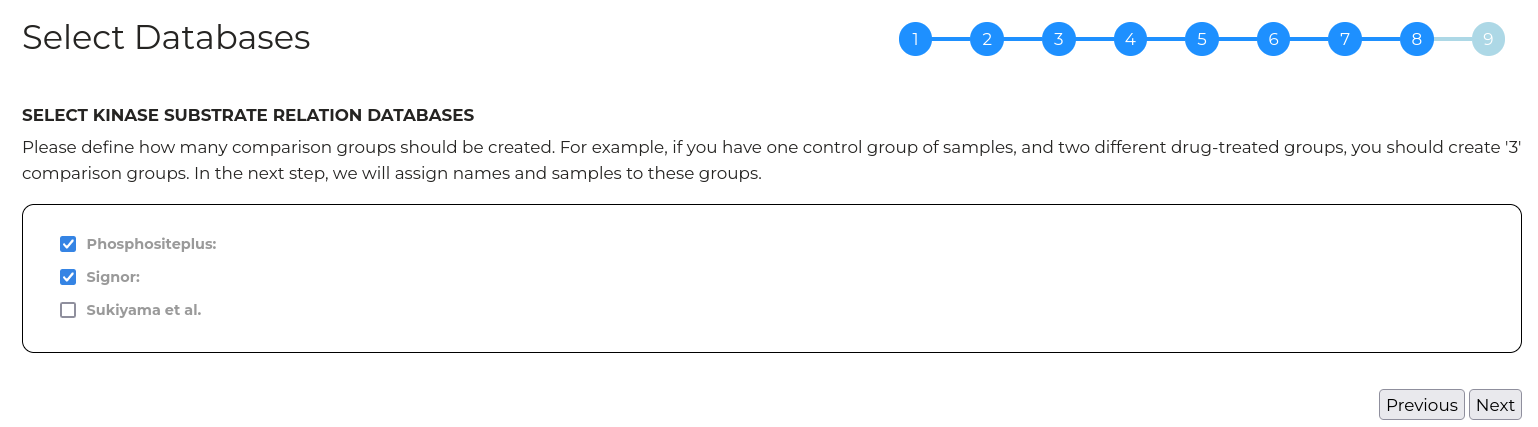
Wizard step 8 - Select Databases
Possible upstream kinases are identified by comparing phosphorylation sites in your input data to databases of known substrate-kinase relationships. The database of these relationiships used by Phosphomatics is drawn from a number of sources listed below. You can select a subset of these databases to use for your analysis if you wish.
Wizard step 9 - Review and Submit
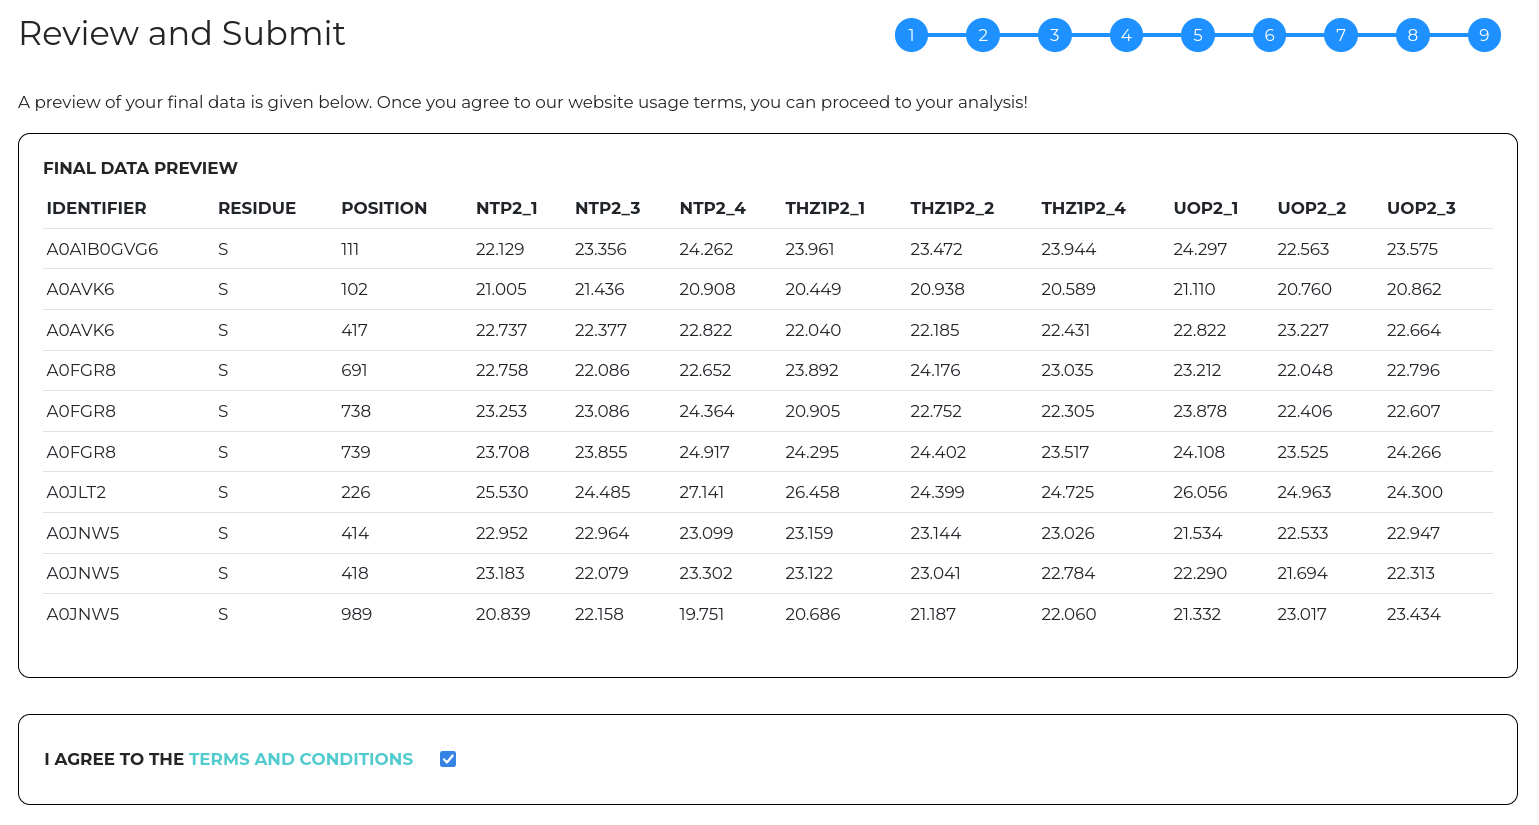
In the final step, a preview is provided of your prepared data after all the selected import options have been applied. At this point, you can go back and edit any of the import parameters prior to starting an analysis.
Once you're happy with the import settings, clicking 'Submit' will start the data processing. For a typical analysis of ~10,000 phosphorylation sites, this typicall takes approximately 5 minutes to complete.
Note that you must read and accept the phosphomatics terms of use prior to submitting an analysis
Since Phosphomatics is a free service supported by The University of Melbourne, we ask that you tell us a little about yourself by providing your position (e.g. PhD student, post-doc etc...), institutional affiliation and country. This is optional but we would appreciate it!
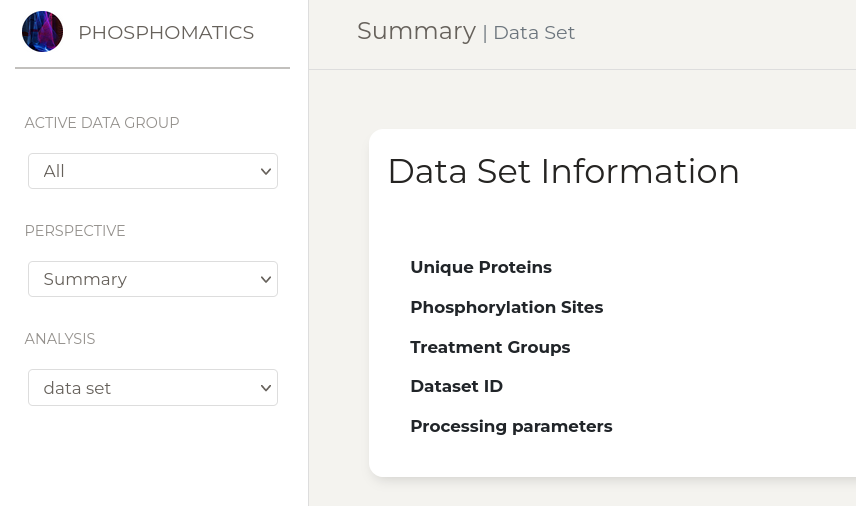
Navigating Phosphomatics
The control panel at the left of the screen is the main interface to different analyses in Phosphomatics. Here you can select the active data group which defines the subset of your data underinvestigation (details below). The 'Perspective' selection allows you to view a different category of analyses. For example in the 'Statistics' perspective you can view volcano plots, clustering analysis, PCA plots etc while the 'Upstream' perspective allows you to investigate upstream kinases for your phosphorylation sites. The 'Analysis' selection box is used to change the individual analysis you are viewing.s
Data Groups
What are Data Groups in Phosphomatics?
Global (phospho)proteomics experiments can identify and quantify thousands of peptides however, typically, the majority of these are not significantly changed in abundance between different treatment conditions and only a small fraction show large and reproducible differences. To help make sense of 'omics data, analyses frequently focus on this latter group of peptides that are significantly changed in abundance since these are most likely to drive or explain observable differences in biological outcomes. This means that, for an entire global phosphoproteomcis data set uploaded to Phosphomatics, we may wish to focus on only a small portion of the observed phosphosites.
To achieve this in a dynamic way, Phosphomatics provides numerous methods that can be used to create subsets of your input data that contain only phosphorylation sites with certain features. For example, groups can be created from clusters of phosphosites appearing in a heatmap, from peptides in the 'significant' regions of a volcano plot, from proteins that share certain Gene Ontology terms etc.
Creating Data Groups
New data groups can be created from the results of a range of different analyses in phosphomatics. The exact process depends slightly on the type of analysis conducted however, in general, clicking the 'Create Group' button present on certain analysis pages will open a menu with a range of options allowing you to customise the contents of the new data group
Data groups can be created from:
- Clusters identified in cluster maps
- Desired regions of volcano plots
- Components of cannonical pathways or gene ontology terms
- known substrates of selected kinases
Working with data groups
Once a data group has been created, you will have the ability to activate it using the dropdown menu in the top right corner of the screen. Once a new data group is selected from the dropdown menu, the active page will be refreshed and the presented analysis updated to include only data from the selected group. For example, if a data group is created from a certain cluster of phosphosites from a heatmap, activating this group from the dropdown menu will result in all subsequent analyses being conducted on only the sites from that cluster and not the entire dataset.
Data groups can also be created from the contents of other data groups (i.e. groups can be 'nested'). For example, a group created from significant peptides in a volcano plot can be futher sectioned into a sub-group containing only nuclear proteins. Through creative use of data groups, complex relationships can addressed and data structures created.
Managing data groups
On the 'Data Groups' tab, you can find a listing of all data groups that have been created from your analysis. The group 'All' is present by default and cannot be deleted. This contains all input phosphosites that passed your selected import filters and is the 'base' for the creation of additional groups..
Clicking 'View' will display a list of all entities in the relevant group while clicking 'delete' will remove the group from your analysis. In the event that you delete the group that is currently active, the active group is reset to the default 'All'.
Statistics Perspective
Cluster Map
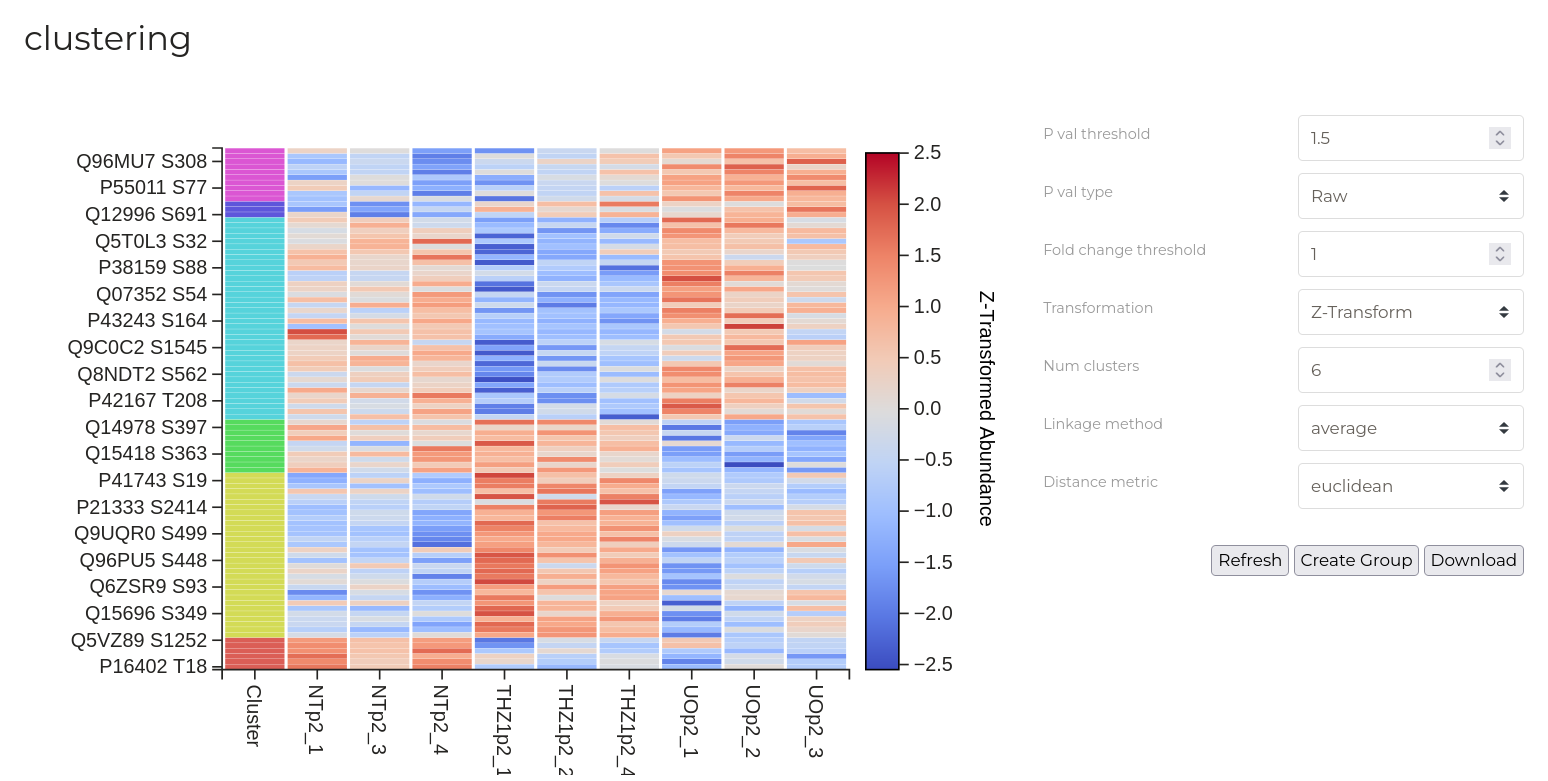
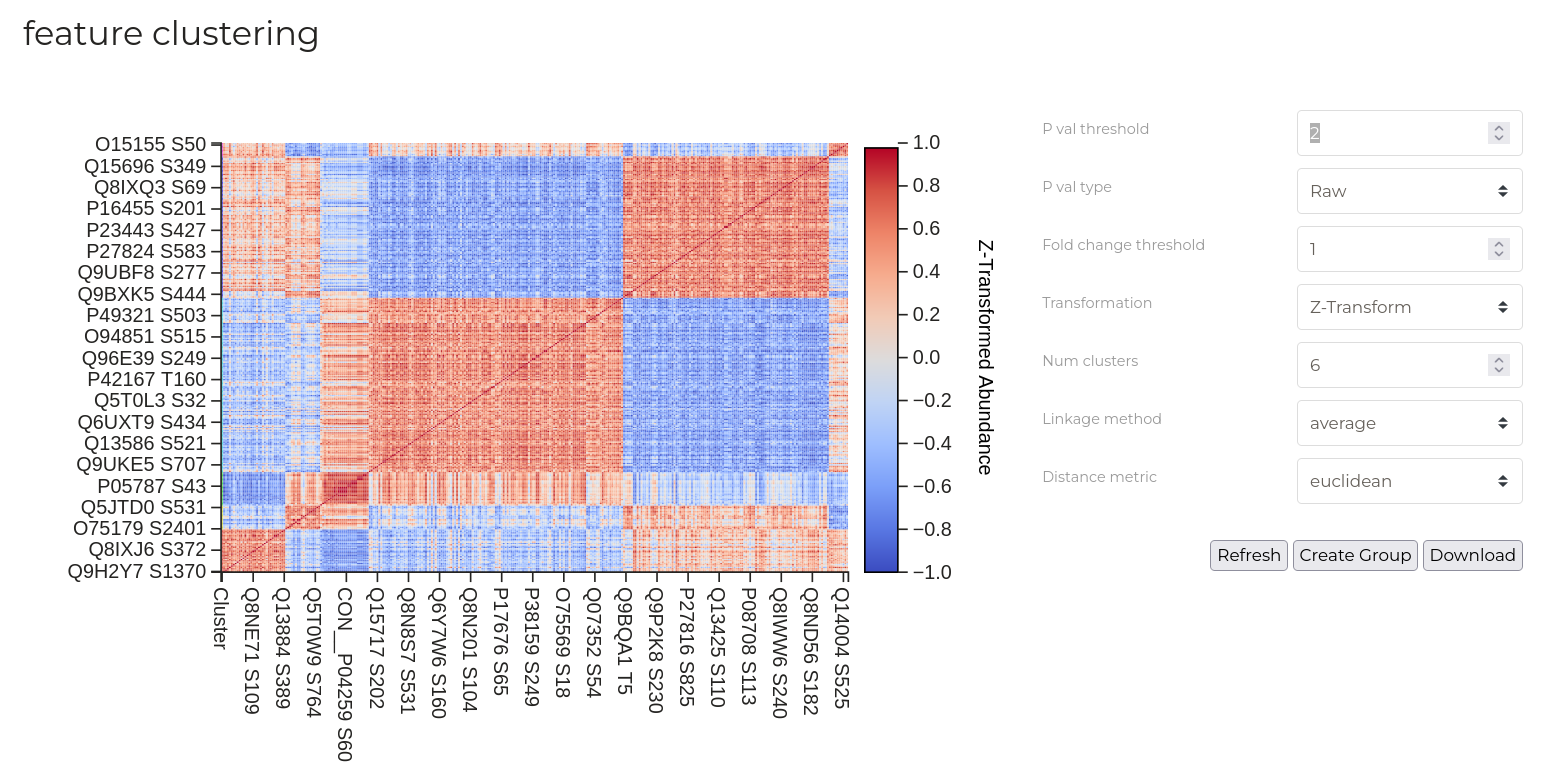
Cluster maps are particularly useful for visualising patterns of phosphorylation site abundance changes between samples and treatment groups. Here, hierarchical clustering is performed to create groups of phosphorylation sites that share similar patterns of abundance changes. A range of plot control options are provided at right which can be used to customise the data, analysis and display settings. After editing these parapeters, click 'Update' to visualise the result.
By default, phosphosite abundances are z-transformed and a mild fold-change and p-value filter is applied to exclude phosphosites that are clearly unchanged in abundance. This can help to create more sharp clusters that may have biological importance. These filters can, however, be removed using the options provided at right. Distinct clusters of phosphosites that have similar patterns of abundance changes are indicated by the colour-coding along the left side of the plot. These are determined by agglomerative hierarchical clustering using distance and linkage metrics that can be customised using the options at right.
New data groups can be created from heatmap clusters. Click the button to open the group creation dialog box. Check one or more of the colour-coded circles corresponding to the clusters you wish to enter into a groups. Provide either a name for the new group or nominate an existing group to which these sites should be added. Then, click 'Create'.
| Parameter | Description |
|---|---|
| -P val threshold | Only phosphorylation sites that have greater than the specified -Log10(p-value) will be included in the analysis. For a >2 group analysis, this is derived from ANOVA. Setting this value to 0 will disable this filter. |
| P val type | Whether to use raw p values or those adjusted for multiple hypothesis testing using the Benjamini-Hochberg method. |
| Fold change threshold | Only phosphorylation sites that have greater than the specified log2(fold change) will be included in the analysis. For a >2 group analysis, this is the ANOVA F-statistic. Setting this value to 0 will disable this filter. |
| Number of clusters | Sets the number of clusters that phsophomatics should attempt to identify in the data. |
| Row-wise transformation | Whether to apply a Z-transform to phosphopeptide intensities prior to clustering. Z-transformation is useful for displaying relationships between the patterns of relative change in phosphosite abundance irrespective of absolute abundance. |
| Linkage method | Methodology used to compute the distance between two clusters. See here for detailed information about this calculation. |
| Distance metric | Methodology used to compute pairwise distances between points. See here for detailed information about this calculation. |
Volcano Plot
A volcano plot is useful for quickly identifying groups of phosphopeptides that have statistically and biologically significant abundance changes between two sample groups. Here, for each phosphosite, the log2(fold-change) between two groups is plotted on the x-axis vs the -Log10(p-value) for the observation on the y-axis. Points, corresponding to individual phosphosites, appearing in the upper left and upper right quadrants of the plot posess both a substantial fold change and significant p-value indicating that these are likely important sites that are related to the differences between the two sample groups.
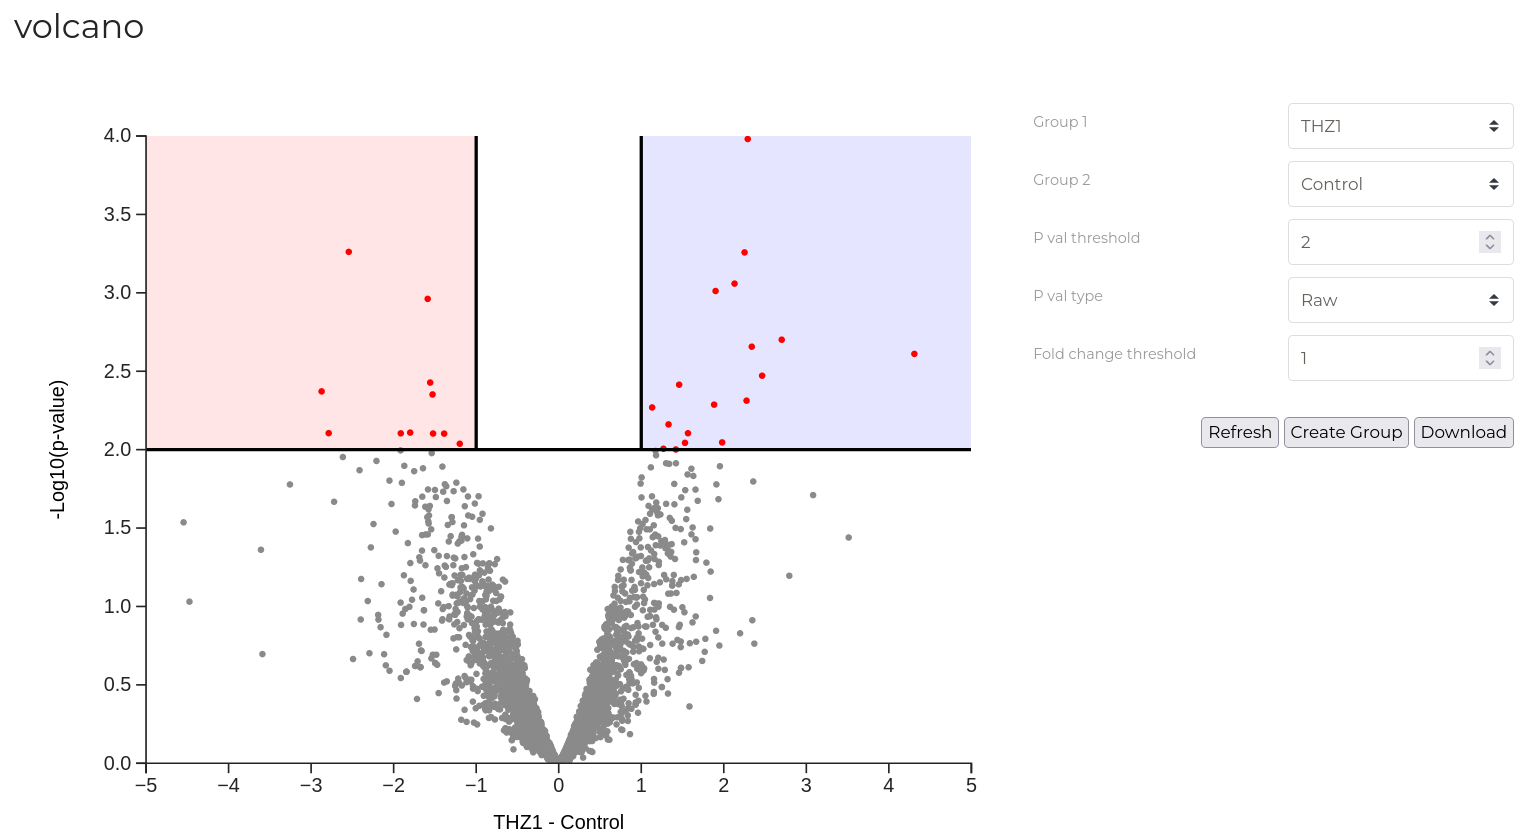
In the example above, 'signifiant' phosphosites are highlighted in red while the remaining sites that do not meet either the p-value or fold change thresholds shown in blue. Horizontal and vertical red lines indicated the positions of the set thresholds.
| Parameter | Description |
|---|---|
| Comparison Group 1/2 | The two sample treatment groups that should be considered in conctruction of the volcano plot. |
| P val threshold | The -Log10(p-value) threshold required for phosphorylation sites to be considered as significant. |
| P val type | Whether to use raw p values or those adjusted for multiple hypothesis testing using the Benjamini-Hochberg method. |
| Fold change threshold | The log2(fold change) threshold required for phosphorylation sites to considered as significant. |
New data groups can be created from the significant phosphosites in the volcano plot. Click the 'Create Group' button to open the group creation dialog box. Provide either a name for the new group or nominate an existing group to which these sites should be added. Select one or both of the color coded circles to indicate the segment of the volcano plot you wish to capture in the new group. Then, click 'Create'.
Feature Correlation
Feature correlations analyses seek to identify groups of features (phosphorylation sites) that have similar patterns of abundance changes between different samples. Here, for each pair of features, abundance values across all samples are used to calculate a pearson correlation coefficient that describes the similarity in the pattern of changes. High coefficients (closer to 1) indicate that a given pair of phosphotylation sites share similar abundance changes while low scores indicate substantial divergence.
Note that producing this plot can be a computationally demanding task when the number of phosphosites to consider is large. As a result, a strict p-value filter is applied by default.
New data groups can be created from heatmap clusters. Click the 'Create Group' button to open the group creation dialog box. Check one or more of the colour-coded circles corresponding to the clusters you wish to enter into a groups. Provide either a name for the new group or nominate an existing group to which these sites should be added. Then, click 'Create'.
| Parameter | Description |
|---|---|
| -P val threshold | Only phosphorylation sites that have greater than the specified -Log10(p-value) will be included in the analysis. For a >2 group analysis, this is derived from ANOVA. Setting this value to 0 will disable this filter. |
| P val type | Whether to use raw p values or those adjusted for multiple hypothesis testing using the Benjamini-Hochberg method. |
| Fold change threshold | Only phosphorylation sites that have greater than the specified log2(fold change) will be included in the analysis. For a >2 group analysis, this is the ANOVA F-statistic. Setting this value to 0 will disable this filter. |
| Number of clusters | Sets the number of clusters that phsophomatics should attempt to identify in the data. |
| Row-wise transformation | Whether to apply a Z-transform to phosphopeptide intensities prior to clustering. Z-transformation is useful for displaying relationships between the patterns of relative change in phosphosite abundance irrespective of absolute abundance. |
| Linkage method | Methodology used to compute the distance between two clusters. See here for detailed information about this calculation. |
| Distance metric | Methodology used to compute pairwise distances between points. See here for detailed information about this calculation. |
Enrichment Analysis
Enrichment Anslysis (or Over-representation analyses) seek to determine if a given set of proteins contains a greater number of entities with certain functional, spatial or procedural characteristics than would be expected by chance alone. As a simple example, if it is known that 10% of all proteins are located in the nucleus and, in your experimental data, 90% of differentially regulated proteins are known to locate in the nucleus, we would strongly suspect that some significant biological change has occured to nuclear dynamics.
New data groups can be created from phosphorylation sites of the proteins that comprise each GO term or pathway. Check the boxes in the 'Action' column of the terms that you want to include in the new group. Once all desired terms have been selected, Click 'Create group from selected' and provide a name for the new group or select an existing group to which the current selection should be added..
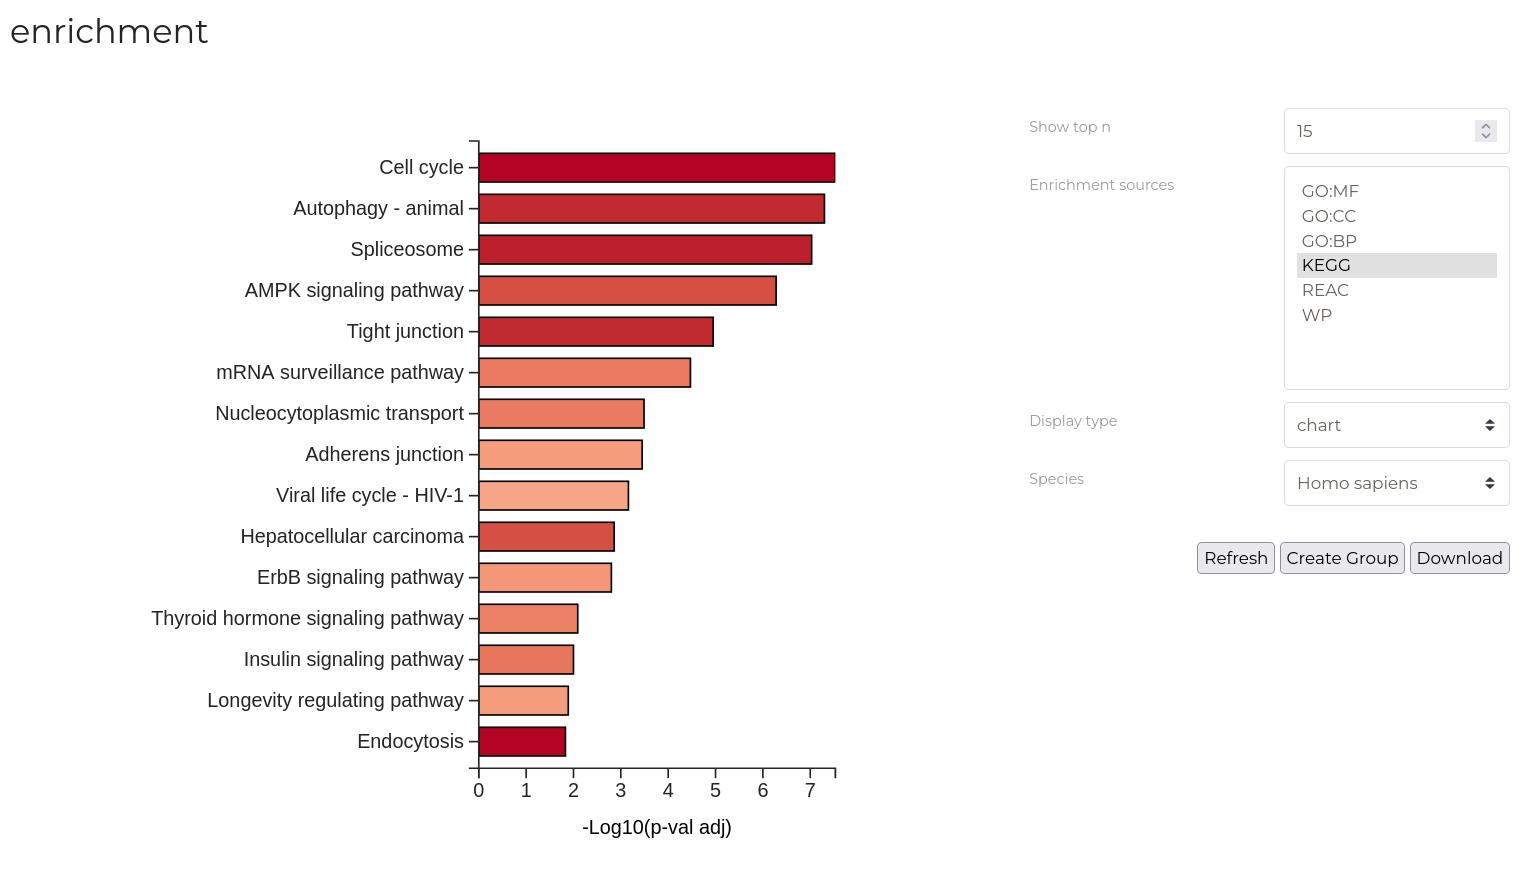
| Parameter | Description |
|---|---|
| Show top n | Number of terms or pathways to be displayed in the resulting plot. |
| Enrichment sources | The categories of GO terms or pathway databases for which enrichment results are displayed in the resulting plot. Multiple can be selected by holding 'control' and clicking. |
| Display type | Display the results graphically or in a table. Note, new groups are created by selecting entries in the table only. |
| Specices | Species for which enrichment results are displayed in the resulting plot. If no results are displayed, ensure that you have selected the correct species. |
New data groups can be created from the significant phosphosites in given ontologies or pathways. Set the 'Display type' to 'table' and refresh your analysis. Select the checkboxes in the 'Action' column for the terms you wish to include int he new group. Click the 'Create Group' button to open the group creation dialog box. Provide either a name for the new group or nominate an existing group to which these sites should be added. Then, click 'Create'.
Upstream Perspective
Network
The 'Networks' tab displays specific relationships between the substrates in the active data group and known upstream kinases based on data from PhosphoSitePlus and Signor. Network disgrams represent substrates of the active data group as coloured circles and known upstream kinases as green circles. Colour-coding of substrates represents mean fold-change between two selected treatment groups.
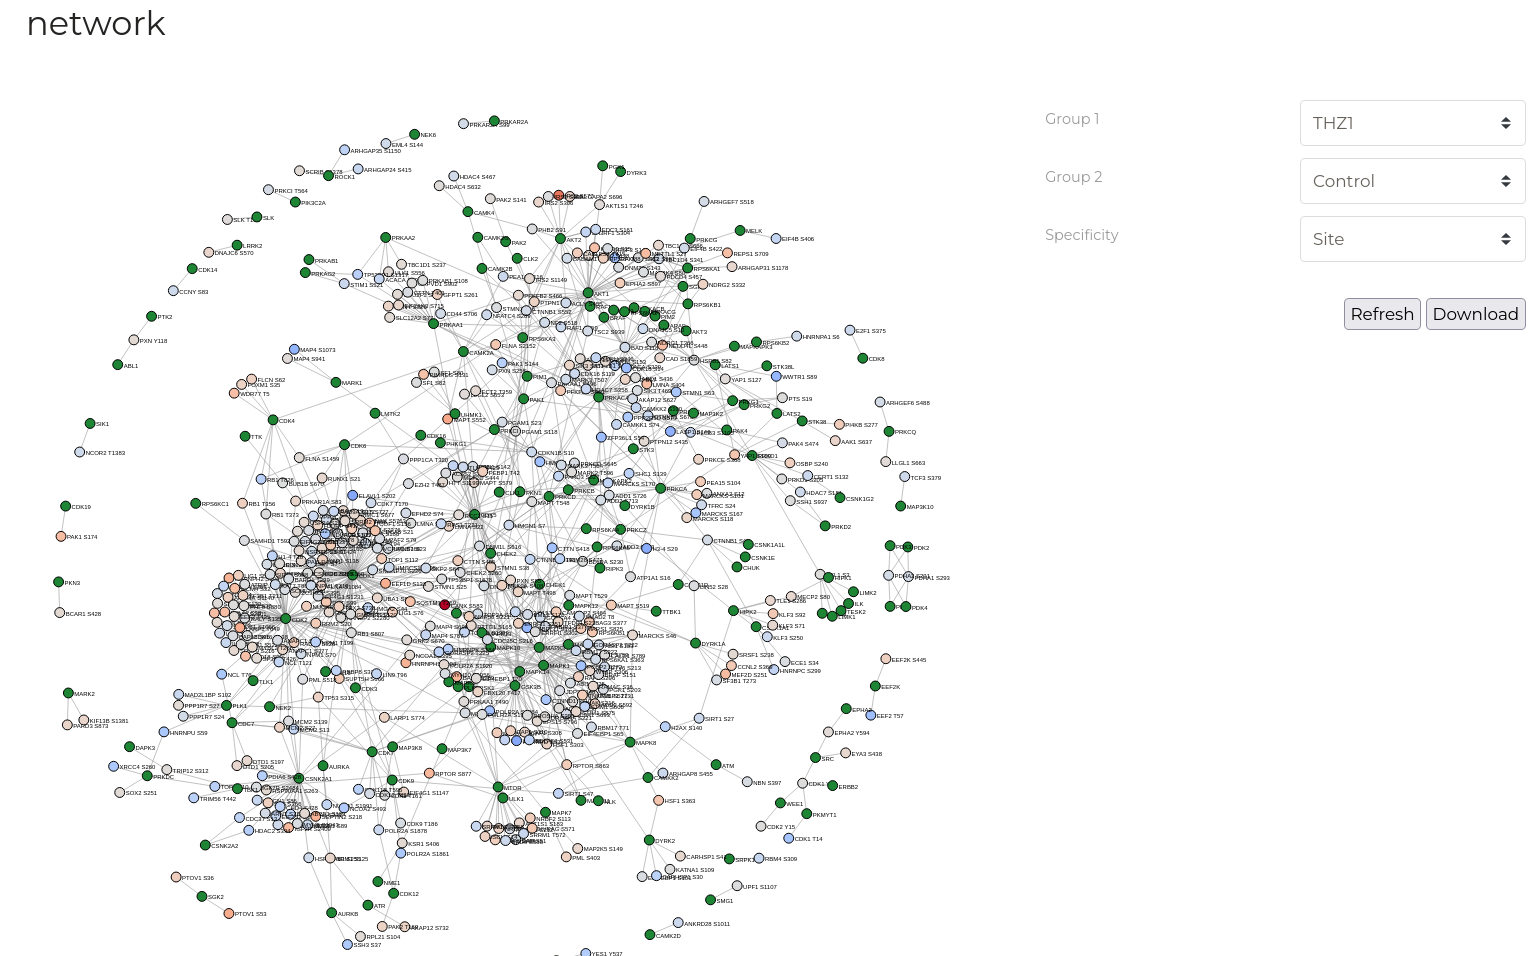
| Parameter | Description |
|---|---|
| Group 1 / Group 2 | The two sample treatment groups defined above that should be used to determine mean fold-change. |
| Specificity | Required specificity of kinase-substrate interactions for inclusion in the networks constructed. Note that selection of 'Protein' level specificity can lead to extremely large graphs that can take some time to calculate and draw - be patient. |
Interactions
Substrate-kinase relationships can be viewed in a tabular format on the 'Interaction Details' page. Here, clicking cells corresponding to either substrates or kinases will open a window that protein functional information and external links drawn from UniProt. Each substrate-kinase relationship has a dedicated page summarising additional evidence for this interaction which can be accessed by cliking the 'Investigate' button.
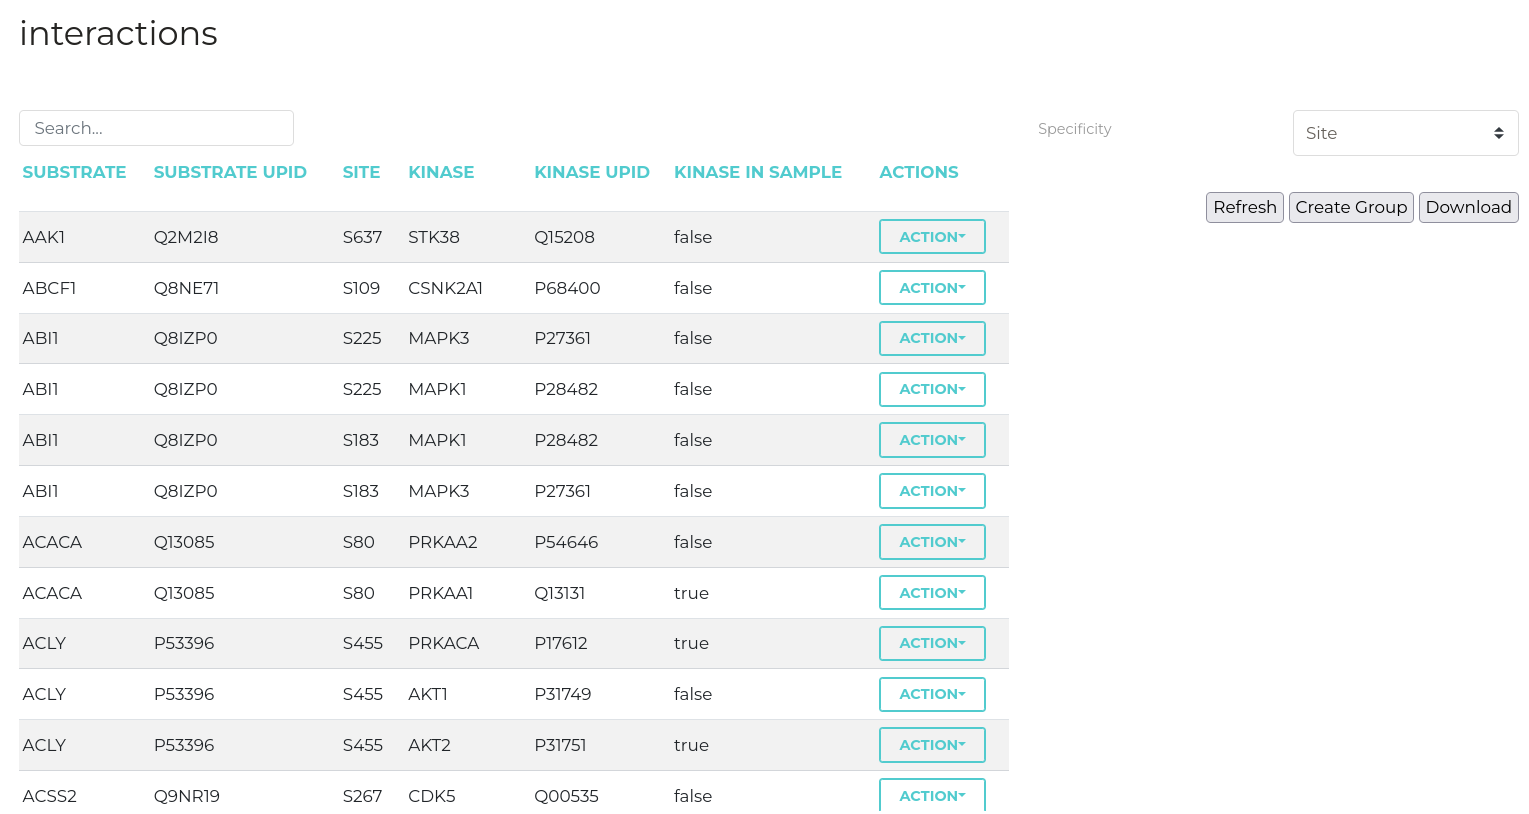
| Parameter | Description |
|---|---|
| Specificity | Required specificity of kinase-substrate interactions for inclusion in the networks constructed. |
KSEA
The KSEA tab implements the Kinase-Substrate Enrichment Analysis as described by Casado et. al.using the scripts of Wiredja, et. al.. This analysis attempts identify kinases that are associated with phosphorylation sites in a data set that substantially differ in abundance between two treatment groups.
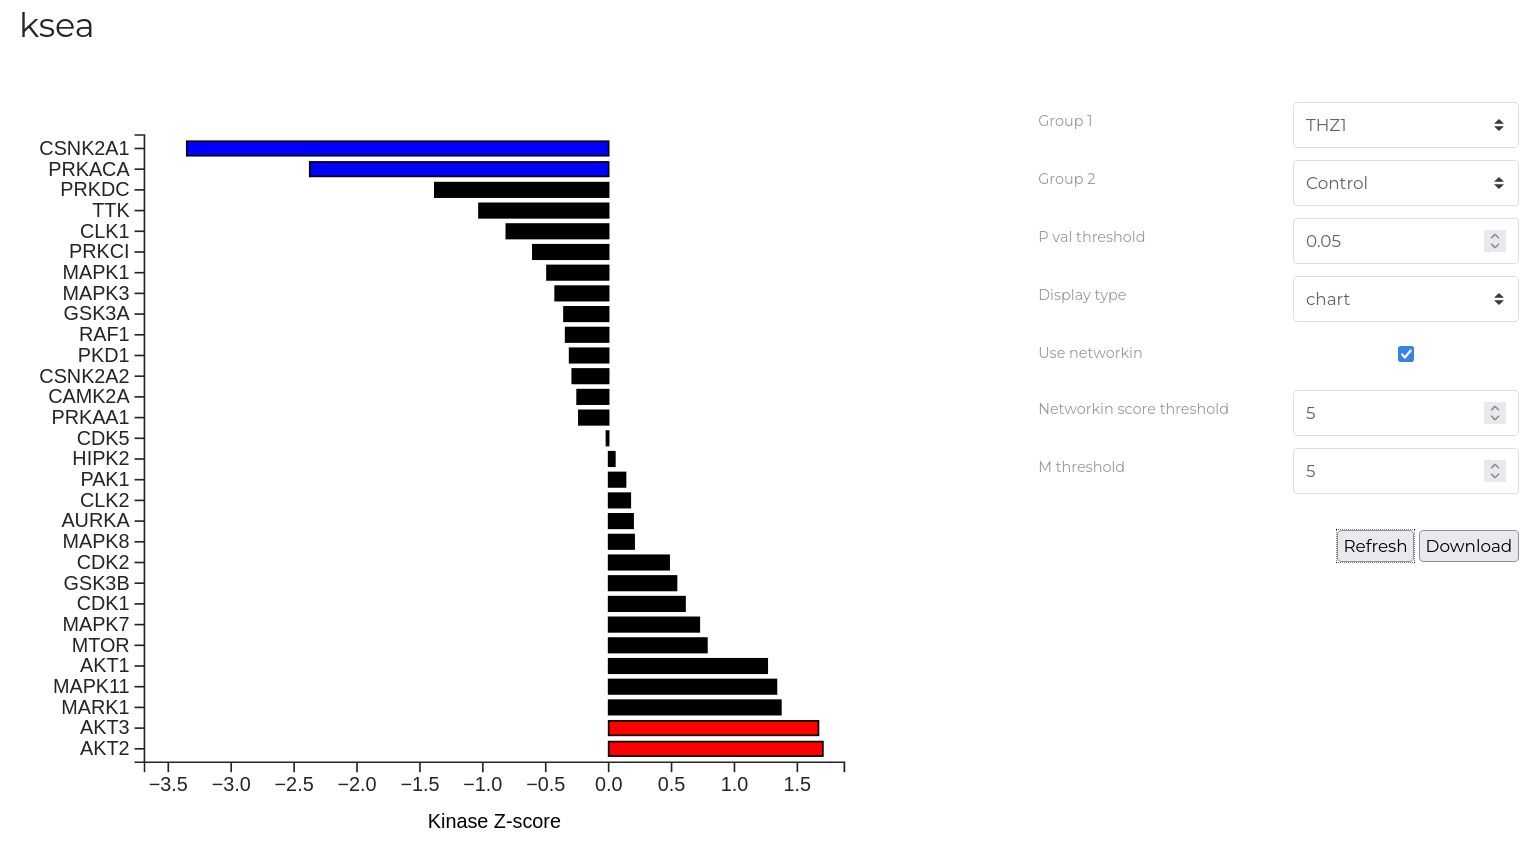
The plot above shows the Z-score for enrichment of different kinases in the example data set for the control and THZ treated groups. Kinases with Z-scores greater than 0 are more active in the control group. In this experient, THZ is a CDK7 inhibitor and this is reflected in the greater activity of CDK7 in the control group vs THZ-treated group.
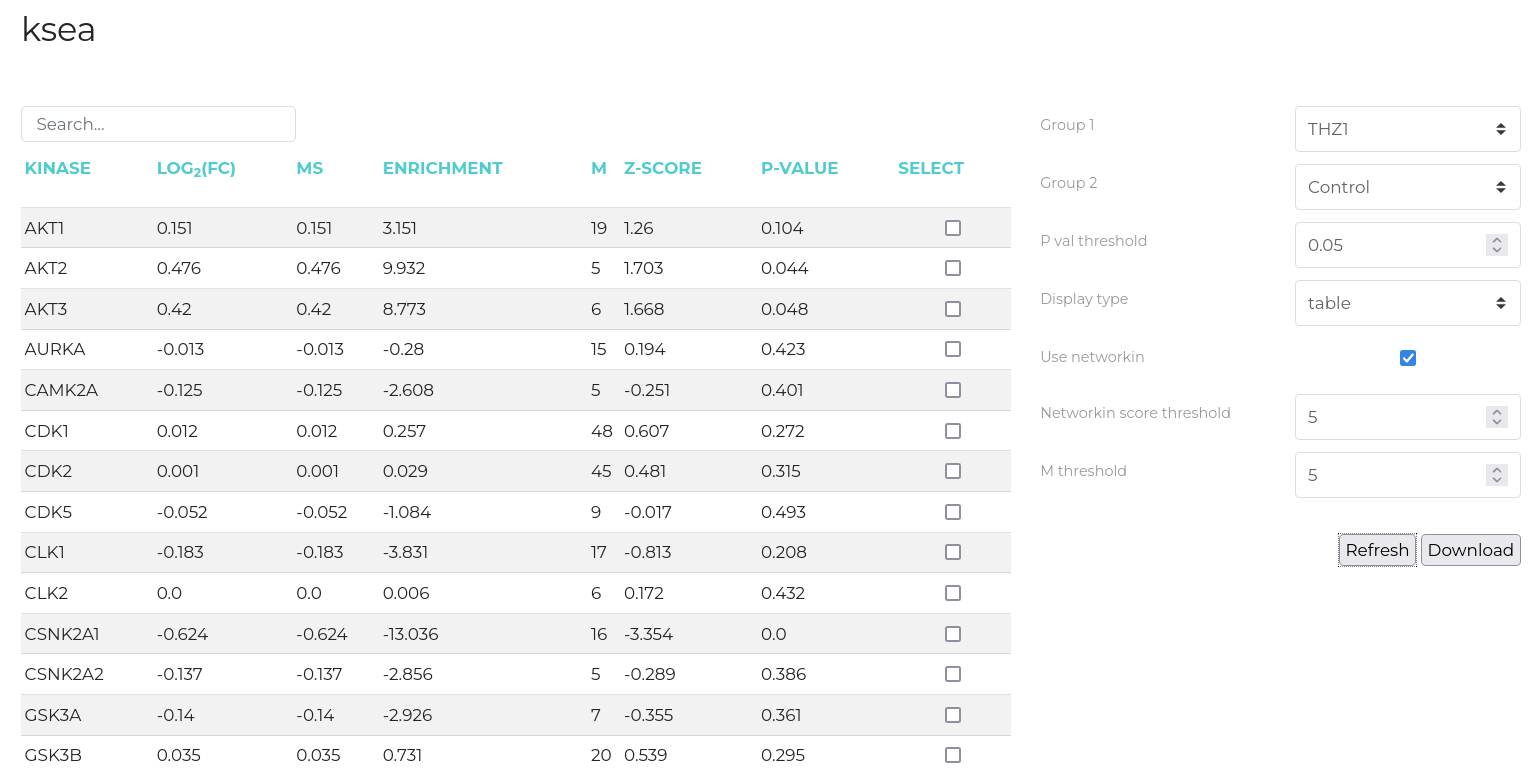
A more detailed breakdown of the KSEA results is available in a tabular format
New data groups can be created from the substrates of KSEA-identified kinases. First, check the box next to the kinases whose substrates you wish to add to the new group in the results view table (above). Next, click the 'Create Groups' button to open the group creation dialog box. Provide either a name for the new group or nominate an existing group to which these sites should be added. Then, click 'Create'.
Definitions of the KSEA table columns are given below:
| Parameter | Description |
|---|---|
| Log2FC | Mean Log2 fold change of substrates for each kinase |
| Enrichment | Mean Log2 fold change of a given kinases substrates divided by mean Log2 fold-change of substrates for all kinases |
| m | Number of substrates for each kinase |
| Z-score | The weighted and standard deviation-normalised score for each kinase |
| p-val | T-test p-value for the observation |
A range of parameters can be modified to refine the KSEA analysis. These are defined below:
Important: For KSEA analysis, all uploaded phosphorylation sites that have passed the selected import filters are used for analysis regardless of the currently active data group. That is, KSEA is conducted with the constituents of the 'all' data group regardless of the currently active selection. This is because KSEA computes a z-score for the enrichment of a certain kinases' phosphorylation sites compared to the aggregate of all phosphorylation sites which would become invalid as smaller data subsets were selected. This is the only time in phosphomatics wherein calculations are not performed on the currently active data group.
| Parameter | Description |
|---|---|
| Group 1 / Group 2 | The two sample treatment groups defined above that should be considered for KSEA analysis. |
| Use NetworKIN | KSEA uses kinase-substrate relationship data from PhosphoSitePlus to link observed phosphorylation sites to upstream kinases. However, only a small fraction of kinase-substrate relationships have been identified, characterised and indexed in PhosphoSitePlus meaning that much of the input data will be unused. NetworKIN is an upstream kinase prediction algorithm that can be used to supplement the experimental PhosphoSitePlus data used by KSEA. This can allow for greater fractions of input data to be assigned to upstream kinases and then be considered by KSEA. The use of NetworKIN predictions can be disabled by unchecking this box. |
| NetworKIN Threshold | Minimum NetworKIN score for a relationship to be utilised in KSEA analysis. |
| m Threshold | For a given upstream kinase, m is the minimum number of substrates in the input dataset that must be assigned to this kinase for it to be included in KSEA analysis. |
| p-val Threshold | Statistical significance threshold for a given kinase to be included in the output graphics. |
Kinase Explorer
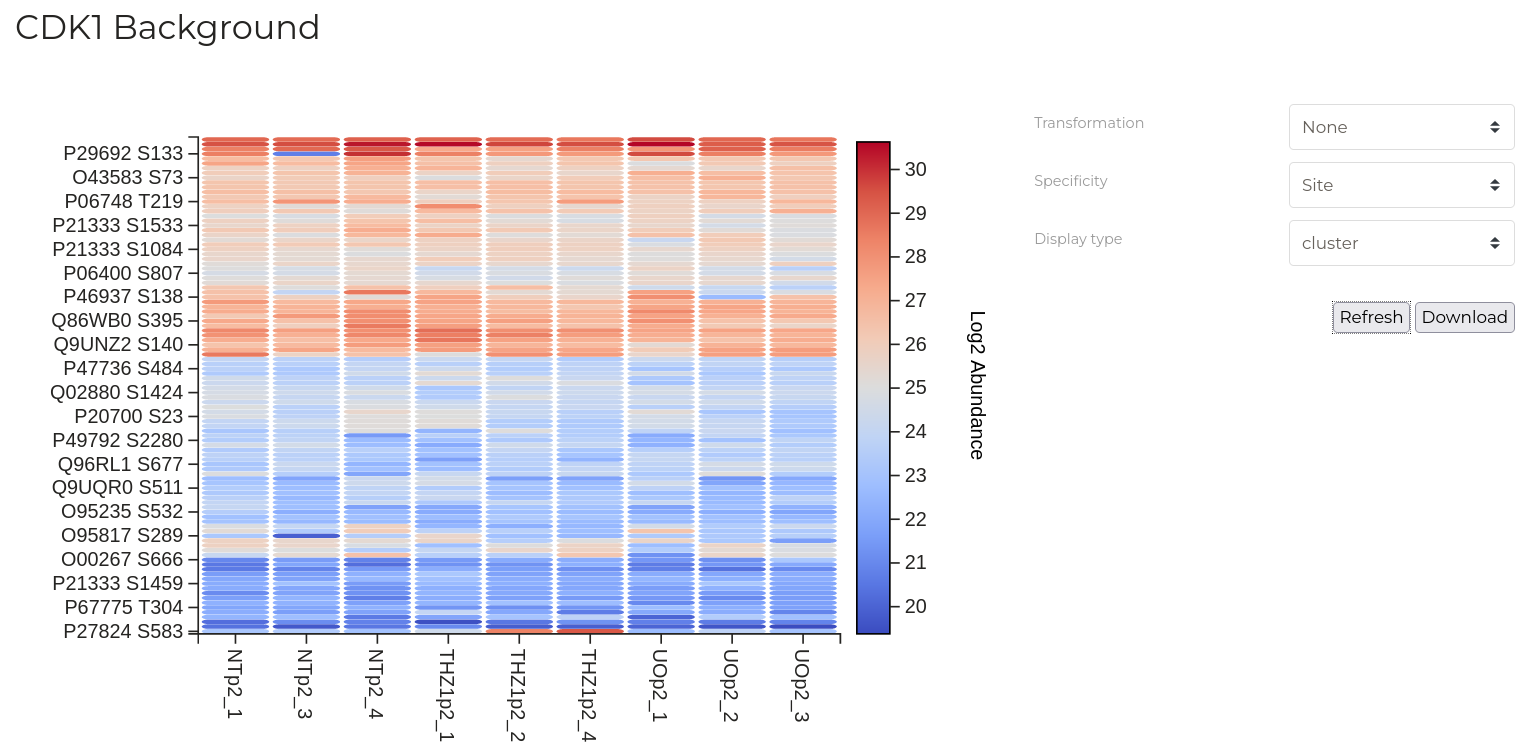
Substrate Quantitation
| Parameter | Description |
|---|---|
| Transformation | Transformation to apply to the data. |
| Specificity | Required specificity of kinase-substrate interactions for inclusion in the networks constructed. Note that selection of 'Protein' level specificity can lead to extremely large graphs that can take some time to calculate and draw - be patient. |
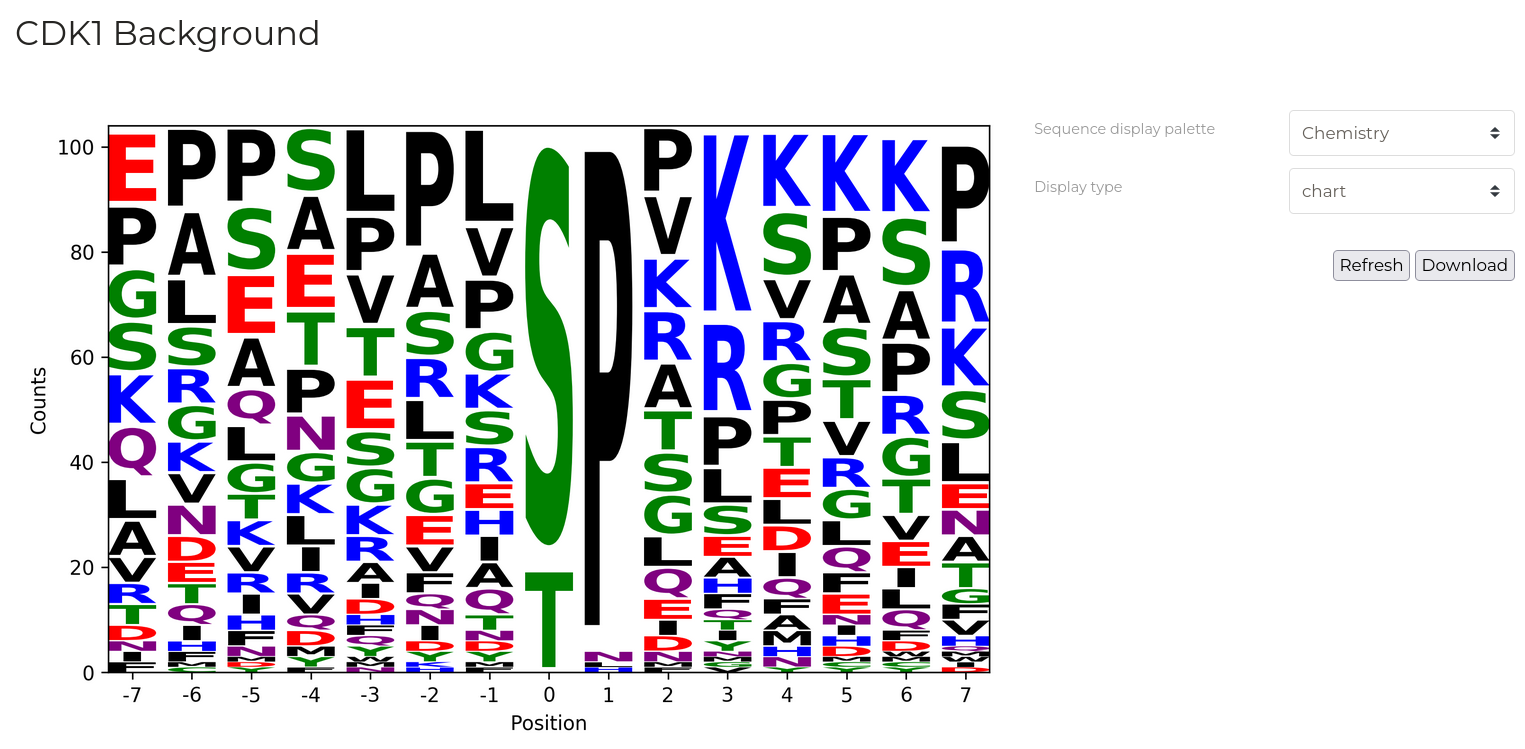
Sequence Analysis
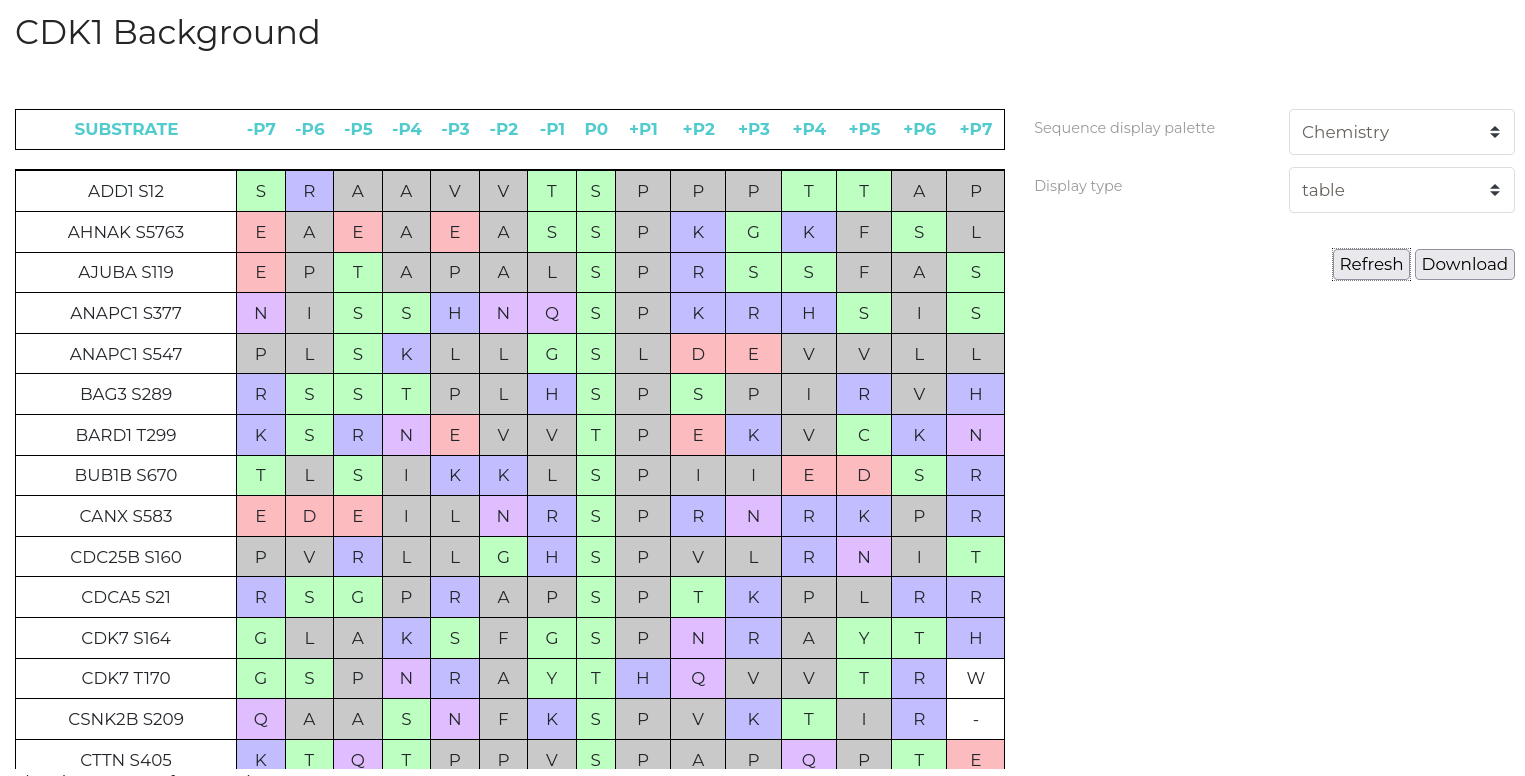
| Parameter | Description |
|---|---|
| Display Type | Output type to display. 'Table' for a detailed list of phosphorylation substrate sequence windows for the selected kinase, 'Logo' for a graphical depiction of residue frequencies at each position. |
| Sequence display palette | Colour residues by various physicochemical properties. |